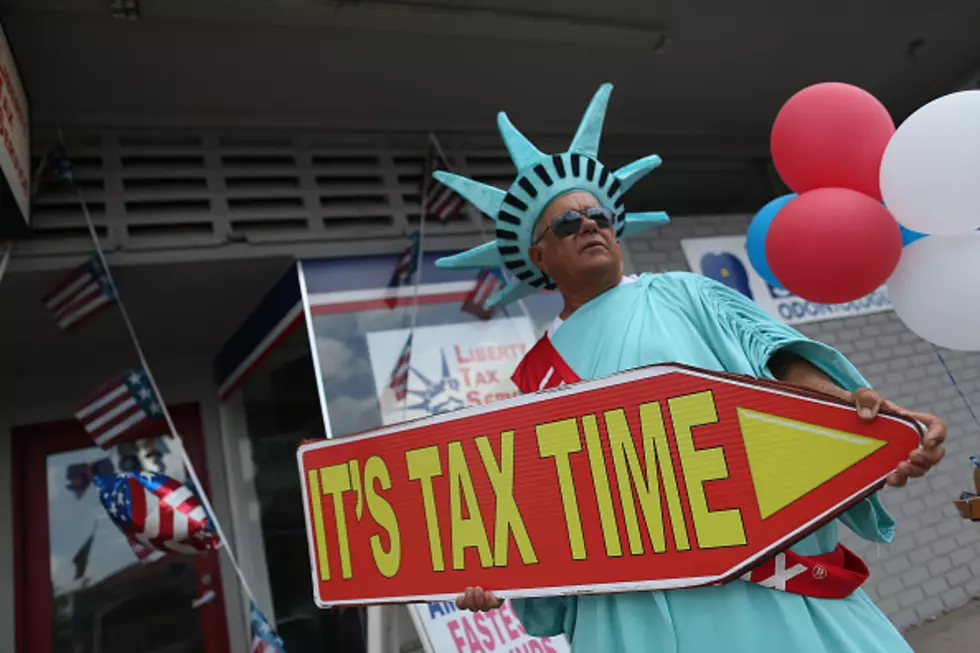
Louisiana/Texas Tax Bracket Changes Revealed for 2023
In Louisiana the struggle is real. No, it's not the struggle to put food on the table and keep gas in the car. It's more about keeping the money we earn in our own pockets and out of the hands of state and federal agencies who want to spend our hard-earned money on programs that don't work.
Or, even worse than the programs that just don't work are the programs that don't make sense. For example, you and I have already invested some of our tax dollars into studies that determine if "humans have an individualized butt print like they have fingerprints". We have also spent our money on "how to turn monkeys transgender". And, we gave some $75,000 to researchers at Harvard to study the "effects of blowing lizards off trees with leaf blowers". Meanwhile, in Louisiana, we spent money on whatever is going on in the picture below.
And while all of those programs seem like completely worthwhile investments (sarcasm) there are some of us who would like to keep more of our own money for funding our own studies. You know studies like "How much beer does it take to make watching the NFL tolerable", or "The effects of Dancing with the Stars on people who are not really famous nor good at dancing" and my favorite "Can members of a certain political party find their backsides if given the use of two hands".
Now those are programs I would be willing to allow my tax dollars to be used for. In the meantime, I am, like you going to do everything I can to keep my money in my hands. One way to keep more of your money is to know what your "tax bracket" is. Your tax bracket is roughly how much money you should pay in taxes for the money that you earn.
Inflation could play a big part in bumping you up to a higher tax bracket, despite the fact that it usually means you have less money to spend. One of the ways inflation causes "bracket creep" is when you have reduced deductions or credits because you didn't spend the money because things cost more. Those changes can make your apparent income seem larger and in the eyes of the Internal Revenue Service, that means you owe a higher percentage.
The IRS basic tax brackets have remained the same from last year. They are 10%, 12%,22%,32%,35%, and 37%. Your income is going to be taxed at one of those seven levels based on how much you make and what your filing status is. Here are the parameters for each bracket and the amount earned.
Here are the 2023 Federal Income Tax Brackets and Rates for Single Filers:
- 10% tax rate - $0-$11,000
- 12% tax rate - $11,001 to $44,725
- 22% tax rate - $44,726 - $95,375
- 24% tax rate - $95,376 - $182,100
- 32% tax rate - $182,101 - $231,250
- 35% tax rate - $231,251 - $578,125
- 37% tax rate - $578,126 or more
Here are the 2023 federal income tax brackets and rates for married couples filing jointly:
Here are the 2023 federal income tax brackets and rates for married couples filing separately:
- 10% tax rate - $0-$11,000
- 12% tax rate - $11,001 to $44,725
- 22% tax rate - $44,726 - $95,375
- 24% tax rate - $95,376 - $182,100
- 32% tax rate - $182,101 - $231,250
- 35% tax rate - $231,251 - $346,875
- 37% tax rate - $346,876 or more
Here are the 2023 federal income tax brackets and rates for head-of-household filers:
- 10% tax rate - $0-$15,700
- 12% tax rate - $15,701 - $59,850
- 22% tax rate - $59,851 - $95,350
- 24% tax rate - $95,351 - $182,100
- 32% tax rate - $182,101 - $231,250
- 35% tax rate - $231,251 - $578,100
- 37% tax rate - $578,101 or more
Information used to create these tables was gleaned from the Internal Revenue Service website. You can read more about how these figures were attained via a story published on Al.com.
Road Fatalities: Most Dangerous Time, Day, and Month by State
Gallery Credit: Scott Clow
More From News Talk 96.5 KPEL


